Power BI Beginner Series. Part 1

Spread the love

Since I’m self-taught in Power BI, I’ve always wanted to give back and share what I know with beginners. Many people write and focus on advanced or the most popular topics, so I wanted to focus on beginners. So, I’m starting the “Power BI For Beginners” series, where I start from the beginning and discuss everything for a smooth start for using Power BI.

In this post, I want to give you a short overview of Power BI and start with an overview of the primary tool we use to create a report, Power BI Desktop.

Power BI Simplified Overview

I’ll start with the basics. In general, Power BI consist of 2 (maybe 3) main parts:

  1. Power BI Desktop
  2. Power BI Service

The “maybe 3” is Power BI Report Builder, which is used to create paginated reports. They are a specific type of report, and I won’t go into the details. For now, just know that they exist.

So, how does it work? 

  • If you want to create a simple report, you use the Power BI Desktop.
  • After you finish, you publish a report to the Power BI Service, i.e., to powerbi.com. You do that by simply pressing a “Publish” button.
  • If you want to use (view and interact with) a report, you go to Power BI Service. Nowadays, you can do a lot of creation steps in Power BI Service, but not everything. So, to make things simpler, we disregard this for now.

Power BI Desktop

Today, I want to focus on Power BI Desktop because your report creation journey begins with it.

Installation

I recommend using the MS App Store to download Power BI Desktop because it will be updated automatically. The updates appear quite often, once per month.

Power BI Desktop Overview

Power BI Desktop consists of 2 windows:

  1. Power BI Desktop window – we can call it the main window
  2. Power Query Editor window
Power BI Desktop
Power BI Query Editor

The Power Query window has different top ribbon tabs.

The main window has multiple top ribbon tabs, which change depending on whether or not you press on some visual. But it also has 4 tabs on the left-hand side:

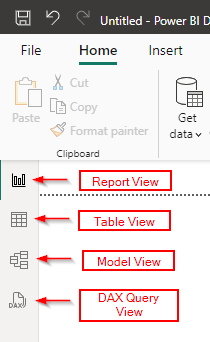
  1. Report View – this is where you create your report’s pages and visuals,
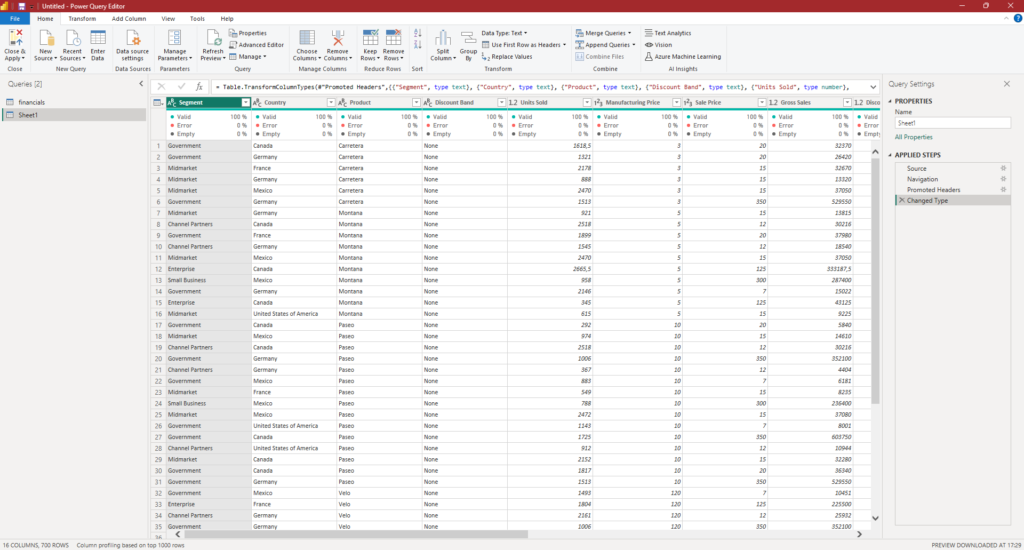
  2. Table View – this is where you can see tables with your data, and you can filter it,
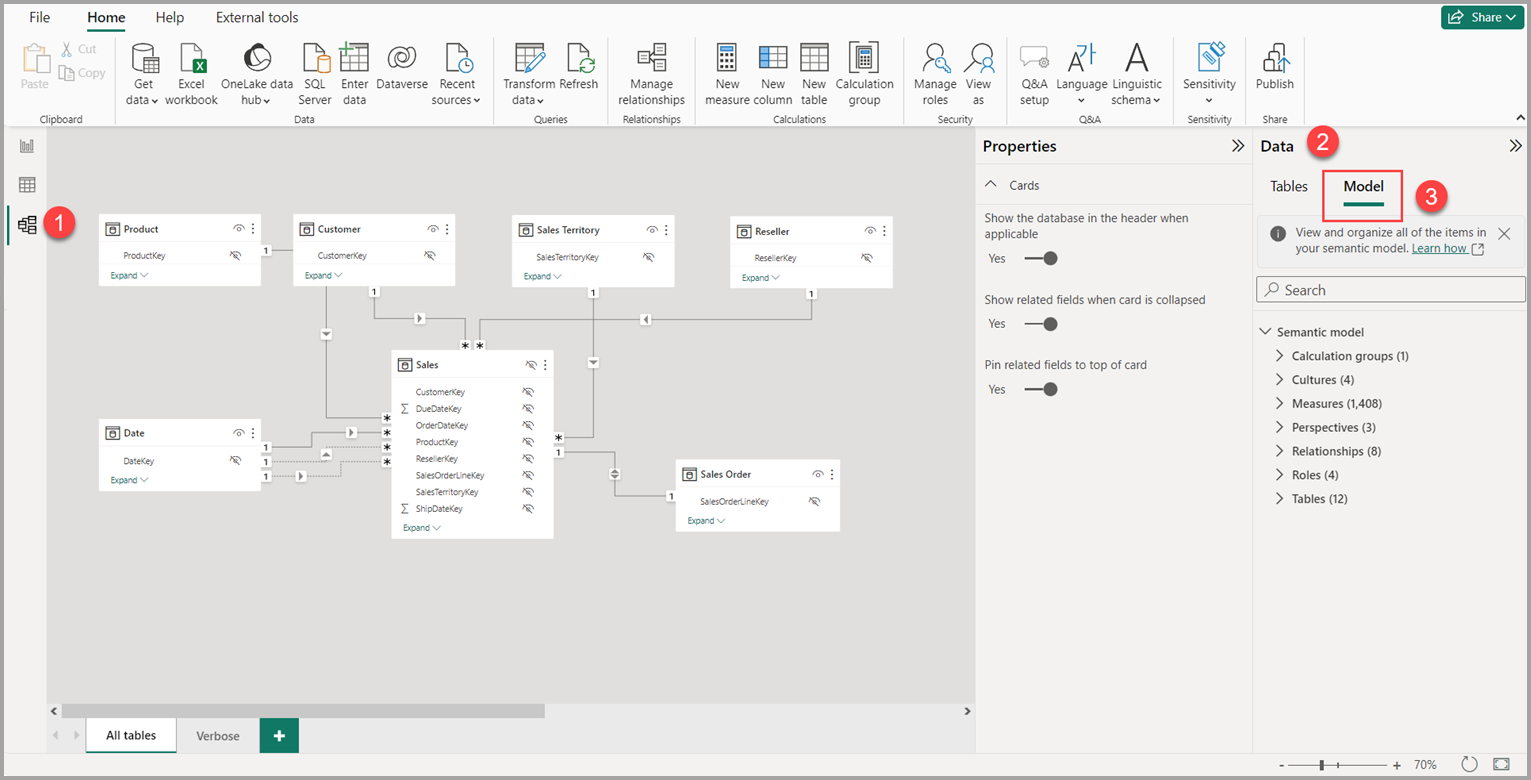
  3. Model View – this is where you connect data tables, i.e., create a semantic model,

    Screenshot of Model view.

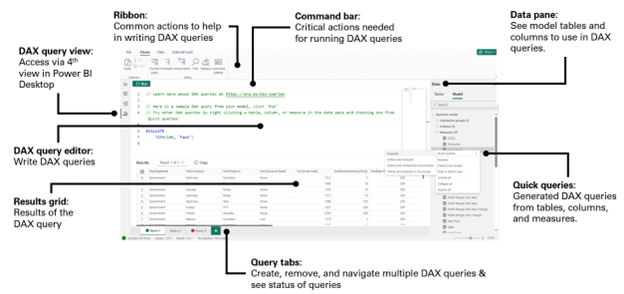
  4. DAX Query View – this is where you can work with DAX queries in your semantic model.
    Diagram that shows the DAX query view layout.

When we go through the whole process of creating a report, I’ll give you more details about each of these views.

Licences

You can start using Power BI without any cost, but you’ll only use it for yourself. When you want to create reports that others could use, you’ll need to buy at least a Power BI Pro licence. There’s also Power BI Premium, which is used when you want to use premium features like Copilot (AI).

Workflow

Now that you know the main parts of Power BI, you probably wonder how to use it. 

  1. Open Power BI Desktop,
  2. Sign in with your account,
  3. Connect to your data,
  4. Clean and transform it,
  5. Create a semantic model,
  6. Create a report,
  7. Publish it to Power BI Service,
  8. Share it with the users.

I’ll talk about each of these steps in future posts.

What's Next?

Now that you know the main things about Power BI, we can explore everything you need to know to get started.

Next time, we’ll see how to start working with Power BI Desktop.


Spread the love

Leave a Comment

Your email address will not be published. Required fields are marked *